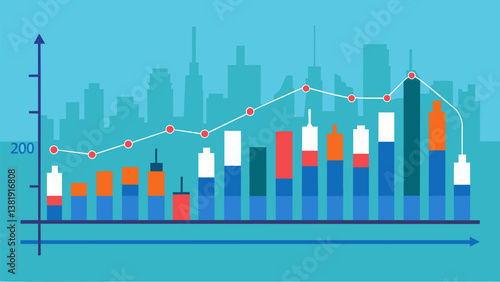
A line graph depicting the average travel time between different areas of a city with the option to filter by specific hours days or months.. Vector illustration
Dobierz idealny dla Ciebie rozmiar i zamów ten obraz na Twoją ściane. Na drukowanych obrazach nie występuje znak wodny "Adobe Stock" oraz numer wzoru.
Specyfikacja wydruku
Grubość ramy
Chcesz dodać dedykacje?
Suma: 165,00 zł
134,15zł netto


Obraz drukowany na płótnie - A line graph depicting the average travel time between different areas of a city with the option to filter by specific hours days or months.. Vector illustration
Cena za obraz 90x50 cm - 165 zł
specyfikacja: A line graph depicting the average travel time between different areas of a city with the option to filter by specific hours days or months.. Vector illustration
-
Typ produktuObraz drukowany na płótnie
-
NazwaA line graph depicting the average travel time between different areas of a city with the option to filter by specific hours days or months.. Vector illustration
-
Płótno:Canvas 380g
-
DrukAtramentowy
-
DrukarkaEpson SC S80610
-
AtramentyEpson Ultrachrome GS3
-
Dostępnośćna stanie
-
CenaObraz 90x50 cm - 165 zł
-
ZastosowanieDekoracje domowe, przestrzenie komercyjne, biura, hotele
-
WykończenieNaciągnięcie na ramę, gotowy do zawieszenia
-
Gwarancja24 miesiące
-
ProducentGaleriaDruku
-
Opis
Wideo Prezentacja produktów
Tak może prezentować się Twój obraz.
Sprawdź wizualizacje dla obrazu A line graph depicting the average travel time between different areas of a city with the option to filter by specific hours days or months.. Vector illustration drukowanym na płótnie. Przedstawiamy kilka wizualizacji wydruku w różej aranżacji oraz kolortyce ścian. Wizualizacje uwzględniają wydruk całego pliku, dokładny kadr i rozmiar możesz wybrać podczas konfigurowania obrazu na górze strony.
Na drukowanych obrazach nie występuje znak wodny "Adobe Stock" oraz numer wzoru.


Więcej z tej serii
Jeśli interesuje Cię to zdjęcie, zobacz więcej z tej serii.

A radar chart indicating the average speed and frequency...
za rozmiar 90cm x 50cm

A visual representation of train lines and routes on a...
za rozmiar 90cm x 50cm
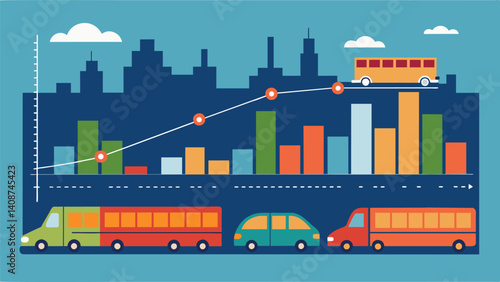
A graph displaying data on commuting patterns and peak...
za rozmiar 90cm x 50cm
A line graph depicting the average travel time between...
za rozmiar 90cm x 50cm

A heat map highlighting the busiest times of year for...
za rozmiar 90cm x 50cm
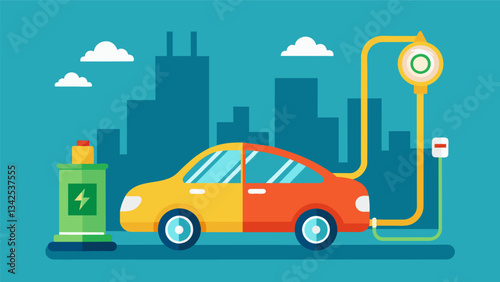
An electric car utilizes data from its battery and...
za rozmiar 90cm x 50cm